
A Very Positive 1st Quarter Despite Potential Headwinds
The Progressive Real Estate Partners team has long been known for its focus on the sale and leasing of retail properties in the Inland Empire. In addition, we also complete a significant amount of transactions in the Eastern San Gabriel Valley, primarily the region from the 605 Freeway east to the Los Angeles County line. As a result, we are including information from this region in our 1st quarter analysis and will do so on a forward basis.
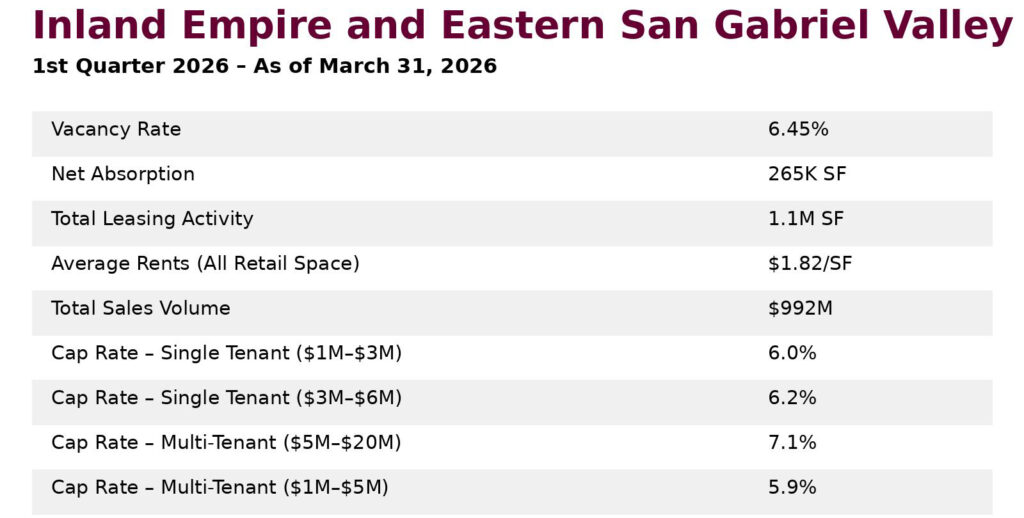
The following is a summary of the key data points followed by commentary, including a deeper dive into the numbers to make the facts more meaningful. (Data Source: Costar)
Key Takeaways
1. Sale of Victoria Gardens Skews Sales Numbers Of the $992M of 1st quarter sales, which is 88% higher than the quarterly average of the past 3 years, $530M can be attributed to the sale of the Victoria Gardens regional mall in Rancho Cucamonga. Victoria Gardens is home to retailers such as Apple, AMC Theatres, Macy’s, Nike, and Chanel, as well as restaurants including Fleming’s, King’s Fish House, Lucille’s Smokehouse, Panini Kabob Grill, Cheesecake Factory, P.F. Chang’s, Paul Martin’s American Grill, and more. Excluding this one transaction, sales volume would have been $462M, which is still 10% higher than the 3‑year average and demonstrates the continued normalization of the market after the very robust period in 2021 and 2022.
2. Average Cap Rates Are of Little Value Although we provided average single‑tenant and multi‑tenant cap rates in the data section, reviewing this information reinforces how limited those averages really are. First, Costar fails to capture a meaningful amount of single‑tenant and multi‑tenant sales because they are unable to obtain a verifiable cap rate for a substantial number of transactions. Second, cap rates are all over the place. Over the past year, single‑tenant cap rates ranged from a low of 3.5% for a McDonald’s ground lease to 12% for a vacant Rite Aid. Even if you remove the 10 highest and 10 lowest cap rate sales, the range is still 4.5% to 6.75%. Third, in any given quarter, there is not enough velocity among similar properties for reported cap rates to be statistically significant. This is why quarterly cap rate charts often appear to show cap rates moving up or down when they really are not. Fourth, and yes this may sound self‑serving coming from a brokerage firm, average cap rates do nothing to capture critical details such as lease term, tenant creditworthiness, quality of the real estate, and lease rate relative to market. A quality broker knows how to incorporate these factors to properly price a property. Multi‑tenant properties are no different and are even more complex because additional factors come into play, including rent roll income distribution, age of the buildings, NNN slippage, and more.
3. Price Point Is Very Important, Especially in Multi‑Tenant We broke out cap rates by several price points to demonstrate the importance of overall price to value. We continue to see mostly all‑cash transactions for properties priced under $5M, and even for some above this level. In our opinion, debt rates are not nearly as important to valuing these lower price‑point properties as are the returns from competitive investment alternatives. Cap rates are still near historical lows. When cash in the bank was yielding 5% or greater, it was easy to simply leave money in the bank. Alternatively, the soaring stock market of the past 3 years—with the S&P 500 up 74% from January 1, 2023, to today—encouraged many investors to “let it ride” and keep their funds in equities. With today’s high‑yield money market funds mostly paying in the 3.3% to 3.7% range and the stock market appearing to be on shakier ground, retail real estate—with the added benefit of tax depreciation—has become more appealing.
4. Net Absorption Fueled by Fewer Business Failures It is fairly typical for the 1st quarter to experience the greatest number of retailer failures, since marginal retailers often hold on through the holiday season and then close their doors early in the new year. This year was different. The positive 265K square feet of net absorption was driven not by very strong leasing activity—which was actually 22% below the average of the past 4 years—but instead by fewer businesses closing. Although 265K of positive net leasing is the 2nd best figure in the past 3.5 years, there were 15 quarters in the past 10 years with over 500K square feet of net absorption for comparison. Our leasing market seems to be paralleling the current labor market with “low hires and low fires.” We can call it “low leasing and low failures.”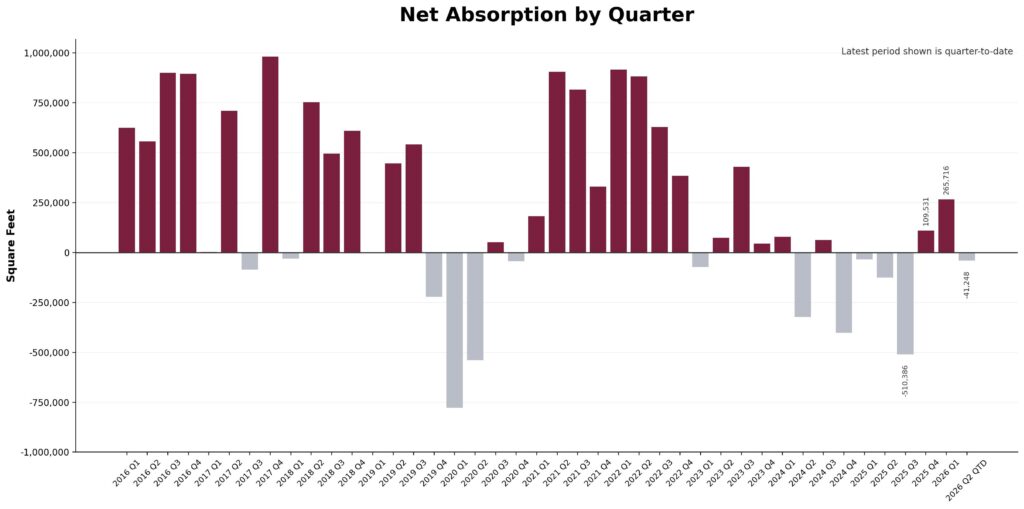
5. What Our Leasing Brokers Are Saying Our leasing team is reporting the following on‑the‑ground trends:
• Continued strong demand for quality shop space in quality centers.
• Restaurant spaces remain in high demand.
• With the low shop vacancy rate, even less desirable shop space is leasing.
• When tenants vacate, backfill rents are almost always higher than the previous rent.
• Triple‑net (NNN) charges are stabilizing.
• Junior and anchor box spaces have largely been picked over; if such a space is still vacant, it is likely a challenging box to lease for various reasons.
• Corporate deals appear to be subject to higher internal scrutiny than in prior years.
6. What Our Sales Team Is Saying Our investment sales team is observing the following:
• Active buyer interest for just about all property types.
• Buyer pools tend to be experienced and are conducting high‑quality due diligence.
• Owners who decide to list are generally more willing to meet the market and are less anchored to valuations from 3 to 5 years ago.
• Tertiary markets remain the most challenging.
• Each deal requires careful underwriting because every transaction feels highly unique.
Conclusion
The 1st quarter of 2026 reinforces a retail market that is both resilient and nuanced. While headline numbers can be skewed by outlier transactions like the sale of Victoria Gardens, the underlying fundamentals—steady demand, limited failures, and disciplined buyers—point to a stable retail environment. Success in today’s market requires moving beyond averages and focusing on the unique attributes of each property. At Progressive Real Estate Partners, we welcome the opportunity to apply our market knowledge and experience to your unique property.