Let’s not kid ourselves, despite the current strength of the retail sector, it is not the retail sector of not that long ago. Traditional merchandise retailers occupy a much smaller share of many shopping centers than they did 20 years ago. But much of that space has been replaced by tremendous growth in other categories, including fitness (Planet Fitness, EOS Fitness, Chuze Fitness and Crunch Fitness), health and beauty (skin care, eyebrow and hair salons, barber shops and spas), indoor entertainment (indoor playgrounds, trampoline parks, bowling and pickleball), medical (dentists, chiropractors, orthodontists and urgent care) and, of course, restaurants.
I have long said that we should consider calling most retail centers “service centers.” Look at a traditional grocery-anchored center. Other than the grocery store, there are very few tenants selling something you can buy on Amazon. Try buying an ice cream cone on Amazon. I dare you.
Here is how these changes are showing up in the Inland Empire (IE) and Eastern San Gabriel Valley (ESGV), where Progressive Real Estate Partners does the vast majority of its work. Based on discussions with our Retail Brokers Network colleagues around the country, I believe many of these same trends are playing out in markets nationwide.
Shop Space Vacancy is Only 3.3%
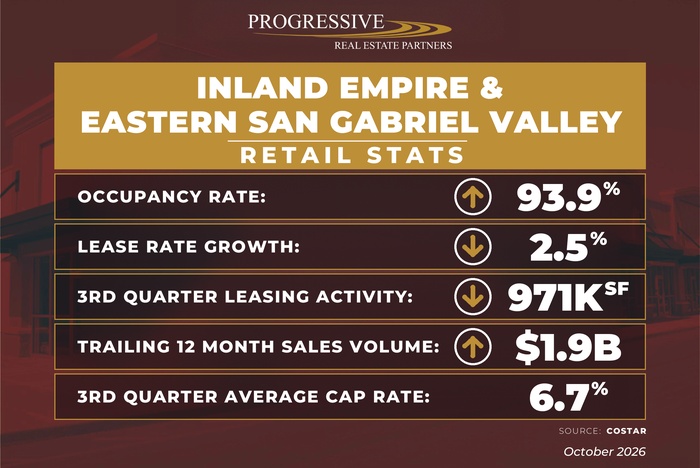
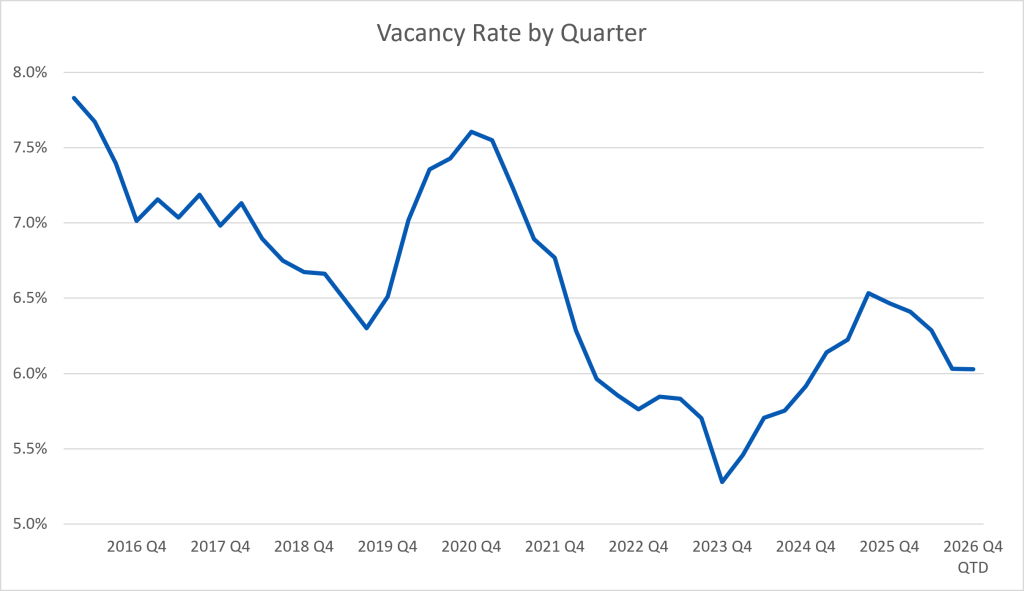
After the wave of 2025 store closures from retailers such as Big Lots, 99 Cents Only Stores and Rite Aid, our market is back under a 6% vacancy rate at 5.9%. That is below the 10-year average of 6.3%.
Here is where it gets interesting. There are approximately 3,800 available spaces across the ESGV and IE, totaling 14.6 million square feet of vacant space. Only 218 of those spaces, or 5.7%, are 15,000 square feet or larger. Yet those larger spaces account for 6.4 million square feet, or 44%, of the total vacancy.
Subtract those sub-anchor and anchor spaces, and only 8.2 million square feet remain vacant. That equates to a 3.3% vacancy rate among what is mostly shop space.
If you are a tenant looking for shop space, the market is very tight, especially in quality assets.
Lease Rates Continue to Rise
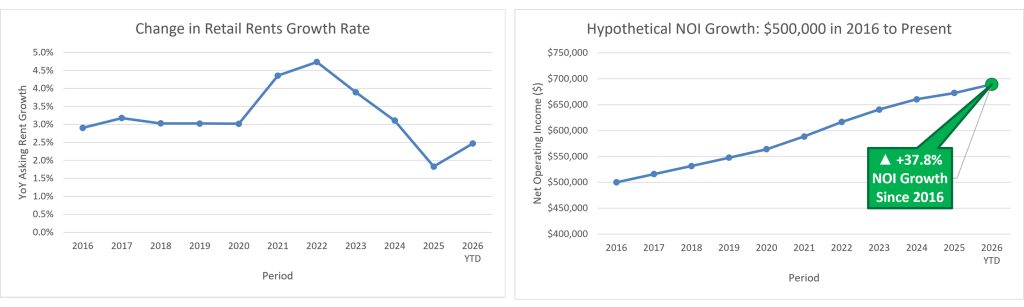
Broad-brushing retail lease rates is always challenging because every space and shopping center is different. CoStar attempts to account for those differences and currently reports that retail lease rates are up 2.5% year over year, compared with a 10-year average annual increase of 3.2%.
Anecdotally, our team frequently sees new lease rates for the same space exceed what the previous tenant was paying. Property owners should not just look at rent, but how re-tenanting a space can make your property better. Improving tenant mix and leasing to tenants who have a high probability of success, also creates additional property value.
It should be noted that it is easier to push rents at properties with NNN charges near or below the regional average of $0.87 per square foot per month. At outlier properties where NNN charges exceed $1.10 per square foot per month, especially those well above that level, pushing the base rent become much more challenging.
Third Quarter Leasing Slowed
Leasing activity in the first and second quarters of 2026 was generally in line with the 10-year quarterly average of 1.46 million square feet. The first quarter recorded 1.5 million square feet of leasing activity, followed by 1.7 million square feet in the second quarter.
The concern is the third quarter, which recorded only 971,000 square feet of leasing activity. Even so, vacancy declined because net absorption was positive, meaning the market occupied more space than it gave back. We will be watching overall leasing activity very carefully in the fourth quarter.
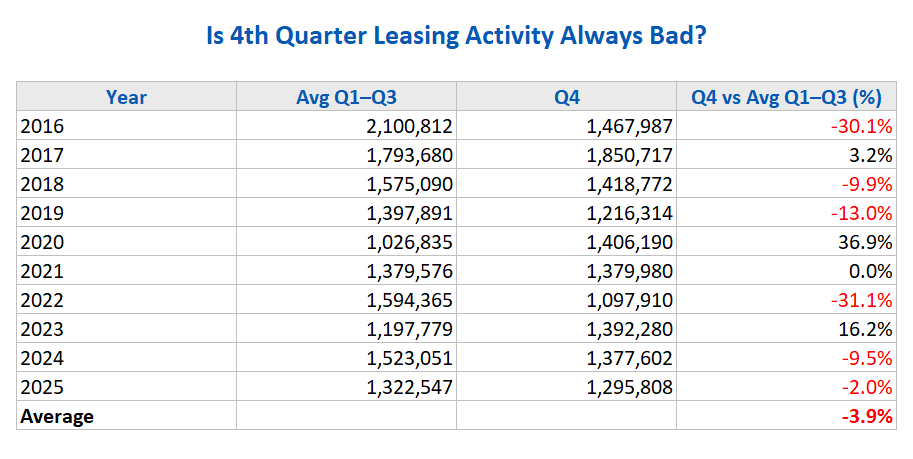
Many people assume leasing activity is always lower in the fourth quarter. We tested that assumption using the past 10 years of data and found that fourth-quarter activity averaged only 3.9% below the average of the first three quarters.
New Construction Remains Limited
In the big picture, new construction is a non-issue. Our market contains 246 million square feet of retail space. Average annual deliveries were 982,000 square feet over the past four years and 1.3 million square feet per year over the past 10 years.
During the past decade, 13.2 million square feet were delivered to the market, representing only 5.7% growth. We do not foresee a meaningful increase in retail construction anytime soon.
Sales Volume Has Recovered
When we report sales volume, we focus on properties priced from $2 million to $20 million. During the past 10 years, 2,943 sales occurred within that range, compared with only 79 sales above $20 million. Those larger deals comprised approximately 2.7% of transactions, but their size can easily skew the dollar-volume data and make underlying trends harder to understand.
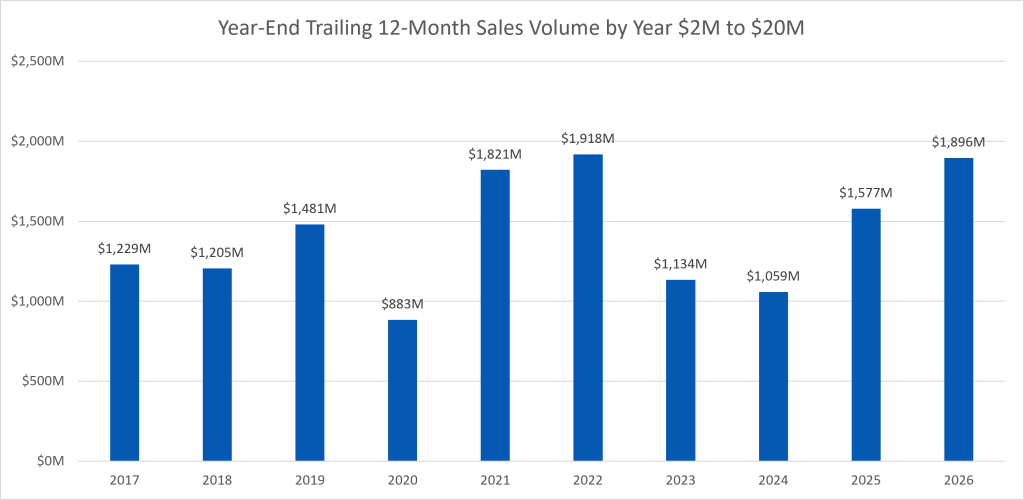
With those caveats in mind, trailing 12-month sales volume is in line with 2021 and 2022, which were very strong years. Why has volume been so high? We believe sellers have adjusted to the reality that many 2021 and 2022 values are no longer achievable. In other cases, net operating income has grown enough during the past five years to offset rising cap rates. In other words, buyers and sellers have moved closer to equilibrium.
We are watching the market closely to see what effect rising short- and long-term interest rates will have has we close out the year and head into 2027.
Cap Rates Require Property Level Analysis
We can never forget that cap rates are specific to each property, so broad cap-rate trends can be misleading. The mix of transactions changes from period to period. One quarter may include more multi-tenant centers; another may include more single-tenant properties. Lower-priced assets may attract all-cash buyers which tend to pay lower cap rates, while higher-priced properties often require debt which may require a higher cap rate. Property age and geography can also shift the averages.
Even within our own firm, our activity may be weighted toward the San Gabriel Valley, where cap rates tend to be lower, or toward tertiary markets, where cap rates tend to be higher. Each property has to be compared with the right subset of comparable sales. This is also why I think people who use AI to value retail properties are frequently off by a lot.
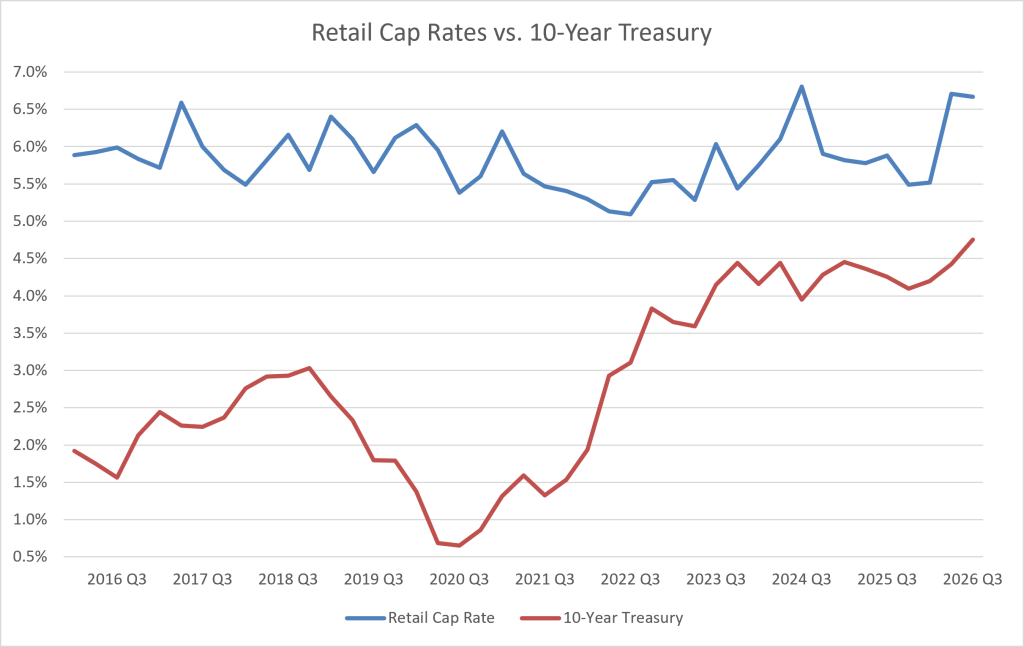
With that in mind, it is useful to look at the relationship between cap rates and the 10-year Treasury. The gap between the two has narrowed during the past two years. A cap rate reflects today’s NOI, and an investor may accept a cap rate closer to the risk-free Treasury rate if the investor believes rents will continue to rise. This is especially true when the buyer can improve the asset and increase rents faster than the overall market.
Wrap – Up
Overall, the regional retail market remains healthy, but the headline vacancy rate does not tell the whole story. Shop space is extremely tight, while a relatively small number of large boxes accounts for a disproportionate share of vacancy. Rents are still growing, although more slowly than the 10-year average. At the same time, the sharp third-quarter slowdown in leasing and the recent rise in interest rates deserve close attention.
For owners of well-located centers, the tight shop-space market may create opportunities to improve rents, tenant mix and credit. For investors, broad cap-rate averages are not enough. The property, submarket, tenant profile, financing and potential for NOI growth all matter.
At Progressive Real Estate Partners, we will continue tracking these trends and comparing the data with what our brokers are seeing in real time. If you are considering a lease, sale or acquisition in the Inland Empire or Eastern San Gabriel Valley, we are always happy to compare notes and discuss what the market may mean for your property.
Data Source: CoStar