
Each month, the Progressive Real Estate Partners team sits together and reviews leases and sales that have been completed in the past month as well as new listings that have been acquired. During one of our recent sessions, I noticed a few lease transactions with NNN charges over $2.00/SF/month as well as a couple of listings that had NNN charges over $2.00/SF/month.
I almost fell off my chair!
The observation of NNN more than $2.00/SF/month caused me to take a deeper dive into this topic.
I asked our leasing team for the NNN charges for each of their approximately 75 lease listings so that at least I had a data set that I could trust. The range of NNN charges across these listings had huge variation ranging from $.33/SF/month to $2.20/SF/month with an average of $.86/SF/month. It should be noted that these listings were located throughout the San Gabriel Valley and Inland Empire regions.
With this data, I started slicing and dicing to try and understand any patterns that might exist. I did utilize Claude.ai to help me analyze the data. My “partner” and I looked at NNN charges by Costar rating, year of construction, and building size.
Here are the observations:
Overall NNN Distribution: Under 10% of the listings had NNN charges below $.50/SF and just under 10% of the listings had NNNs above $1.50/SF. That at least made me feel better that my observation at our company meeting was more of an aberration than the norm. There were only a few listings above $2.00/SF. The median was $.79/SF while the average was $.86/SF.
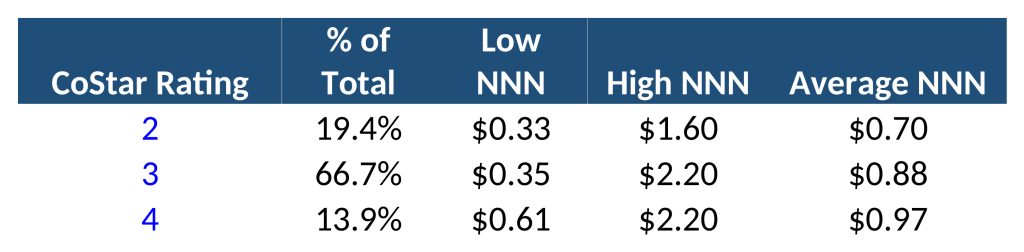
NNN Charges by Costar Rating: Costar rates properties on a scale of 1 (the lowest quality) to 5 (absolute best in class). None of our listings are either 1 or 5. I was expecting to see a direct correlation between lower rated properties having lower NNNs and higher rated properties having the highest NNNs. The theory being mostly that these properties likely had higher rents (which result in higher valuations for property tax purposes) which would have contributed to higher NNN charges and that they were likely better maintained also resulting in higher NNNs.
The expectation was correct, but not by much. You can see the results below.
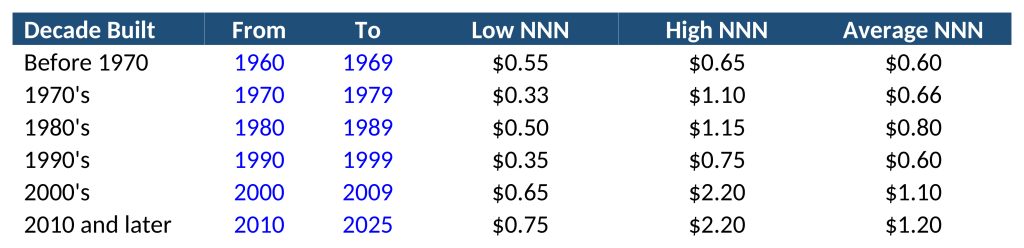
NNNs by Year of Construction: The hypothesis was that the newer the property, the higher the NNN charges. Newer properties tend to have higher building valuations (resulting in higher property taxes), lower building coverage (therefore more parking lot and landscaping to maintain per building square foot), and more restaurants (higher water, sewer and trash usage).
It should be noted that the entire data set used for this blog skews towards higher quality properties due to the fact that the experience of our team and the economics of our business usually makes lower quality listings (which generally have lower NNN charges because property taxes, insurance, maintenance, and lease rates are typically lower on these properties) unprofitable to work on.
As you can see from the table below, age does matter. There is an aberration between the 1980’s to the 1990’s, but I chalk that up to the data pool likely being too small and therefore inconsistencies will occur.
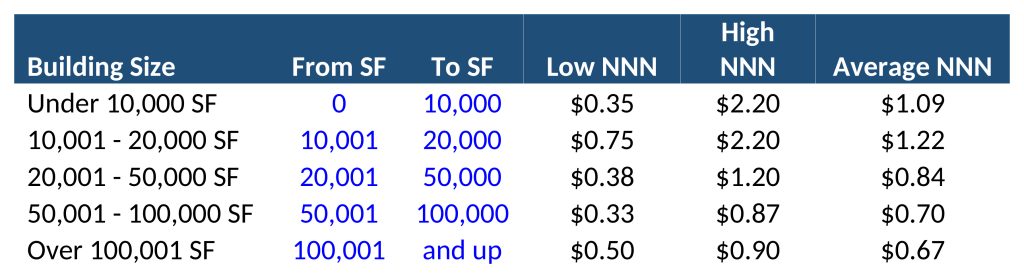
NNN by Shopping Center Size: Looking at NNN charges by building size is where I had the most conviction that there would be a correlation whereby the larger the shopping center the lower the NNNs would be.
Larger shopping centers have a few factors going for them that help keep down the NNNs.
- Economies of Scale. The cost for landscapers, day porters, security, insurance, and other expenses tend to go down on a per square foot basis when the property is larger.
- Large Properties Have Large Anchors: These anchor tenants tend to pay lower rents per square foot which keeps property taxes down. They may also provide a landlord with a greater incentive to manage costs due to NNN caps in their leases.
- Restaurant Uses: Proportionately, smaller properties generally have a higher percentage of square footage dedicated to restaurants which create a lot more trash and have higher water/sewer costs that are shared in common.
How NNN Charges Have Risen Throughout the Years: This section will require you to take a leap of faith with me. I may not remember what I had for breakfast yesterday (well I do, Greek yogurt, strawberries, blueberries, and granola), but I remember with absolute clarity what NNN charges were when I started my career in the early 1990’s. NNN charges on average were $.25/SF/month. High NNN charges back then were $.35/SF/month, and low NNN charges were in the high teens. Just about all of my lease listings (I was a leasing broker from 1992 to 2000) were an average of $.25/SF in 1995. Assuming that the average today (2026) is $.86/SF in the inland regions of Southern California, this means that NNN charges have gone up by approximately 244% over this period which on a compounded basis is approximately 4.1%/year.
I Wanted to Know More: Many of you know that I have been a broker by day but an economics nerd by night. As I dug into this topic, I really wanted to know how property taxes, insurance, and common area costs have changed as a percentage of the total charges over the years. Furthermore, I wanted to try to understand the variation between properties that had similar traits. For example, why do two properties in the same trade area and built at about the same time potentially have very different charges. Was it because one sold in 2022 and the other was built in 2005 and never sold? Or how much do trash, water, and sewer charges vary by city? Or how does insurance vary across the different properties. I started to utilize our library of investment offering memorandums with the idea that I could have Claude analyze a large pool of them but the variation amongst the way NNN charges are represented across offering memorandums would have made this too large of a project. So I quit trying. Maybe another time.
Takeaways and Conclusion
- $2.00+ NNNs are outliers, not the norm. Across our lease listings in the San Gabriel Valley and Inland Empire, NNN charges ranged from $0.33 to $2.20/SF/month, with an average of $0.86 and a median of $0.79. 64% of the properties had NNN charges between $.60 to $1.00/SF.
- Property quality matters, but only modestly. Higher CoStar ratings had higher NNNs as expected, but the spread was narrow: about $0.70 for 2-star, $0.88 for 3-star and $0.97 for 4-star properties.
- Newer properties cost noticeably more. Centers built in 2000 or later averaged $1.10–$1.20/SF, compared with roughly $0.60–$0.80 for older properties. That reflects higher assessed values, more parking and landscaping to maintain per square foot, and more restaurant tenants.
- Size is the strongest predictor. Centers under 20,000 SF averaged $1.09–$1.22/SF, while those over 50,000 SF averaged about $0.67–$0.70. Economies of scale, low-rent anchors with NNN caps, and a smaller share of restaurant space all help larger centers keep costs down.
- NNNs have more than tripled in about 30 years. Average charges rose from roughly $0.25/SF in 1995 to $0.86/SF today, about a 244% increase, or roughly 4.1% compounded each year.